Turning data into clear, practical insight

I'm an aspiring data analyst with a background in data science and human behavior. I enjoy exploratory analysis, visual storytelling, and solving messy problems by breaking them into patterns, trends, and actionable takeaways.

My portfolio focuses on projects in Python, SQL, and data visualization, with an emphasis on making analysis understandable and useful.

  • Analytics
  • SQL
  • Python
Mental Health Spending Trend

Featured Project:
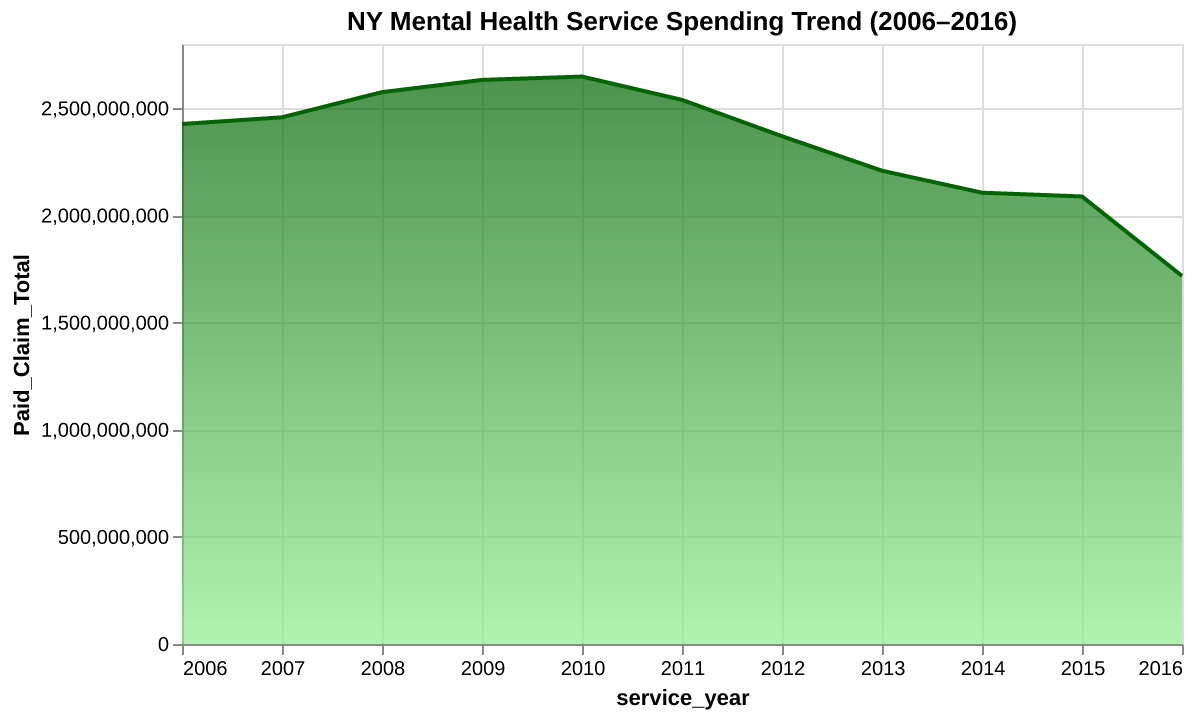
NY County Mental Health Outreach Analysis

An exploratory data analysis project examining county-level community outreach expenditure for mental health services in New York. This project explores patterns across counties and highlights differences in public spending through visual analysis. For example, as we can see visually, spending peaked around 2009–2010 before steadily declining through 2016. This indicates a potential shift in funding priorities over time.

Interactive Mapping
& Geographic Comparison Analysis

This work includes map-based visualization to compare expenditure across counties, making geographic patterns easier to interpret and communicate. The data shows clear regional disparities in mental health outreach funding across New York counties, with some areas consistently receiving higher investment than others. These differences suggest underlying variations in population needs, service utilization, or policy priorities. Understanding these gaps is key to improving equitable distribution of mental health resources statewide.

More projects coming soon

More Portfolio Work
In Progress

I’m continuing to build projects in SQL, Python, dashboards, and business-focused analytics to strengthen both technical depth and communication of results.

Projects, strengths, and tools

A mix of technical skills and project work centered on analysis, clarity, and practical problem-solving.

  • Exploratory Data Analysis

    Cleaning, exploring, and interpreting datasets to uncover patterns, trends, and meaningful business or social insights.

  • SQL

    Writing queries for filtering, aggregation, grouping, sorting, and turning raw tables into useful answers.

  • Python

    Using Python libraries such as pandas, matplotlib, and related tools for analysis, transformation, and visualization.

  • Data Visualization

    Building charts and map-based visuals that make data easier to understand for both technical and non-technical audiences.

  • Portfolio Projects

    Developing public-facing work that demonstrates analytical thinking, structured problem solving, and communication.

  • Storytelling with Data

    Connecting numbers to context so findings are not just correct, but useful, understandable, and memorable.

Let’s connect

Thanks for visiting my portfolio. You can explore my work, connect with me professionally, or reach out for opportunities.